Tracing Eclipse components. This article describes how to trace and perform performance analysis on Eclipse plug-ins and RCP applications.

1. Eclipse Performance
This article gives pointers how to analyze Eclipse performance issues.
One of the things not covered in detail is the creation of performance traces via the PerformanceStats class.
See Gathering performance statistics for more details.
2. Monitoring the interactive UI performance with the UI freeze monitor
The Eclipse IDE includes an interactive UI performance measurement feature.
You can activate this tracing via
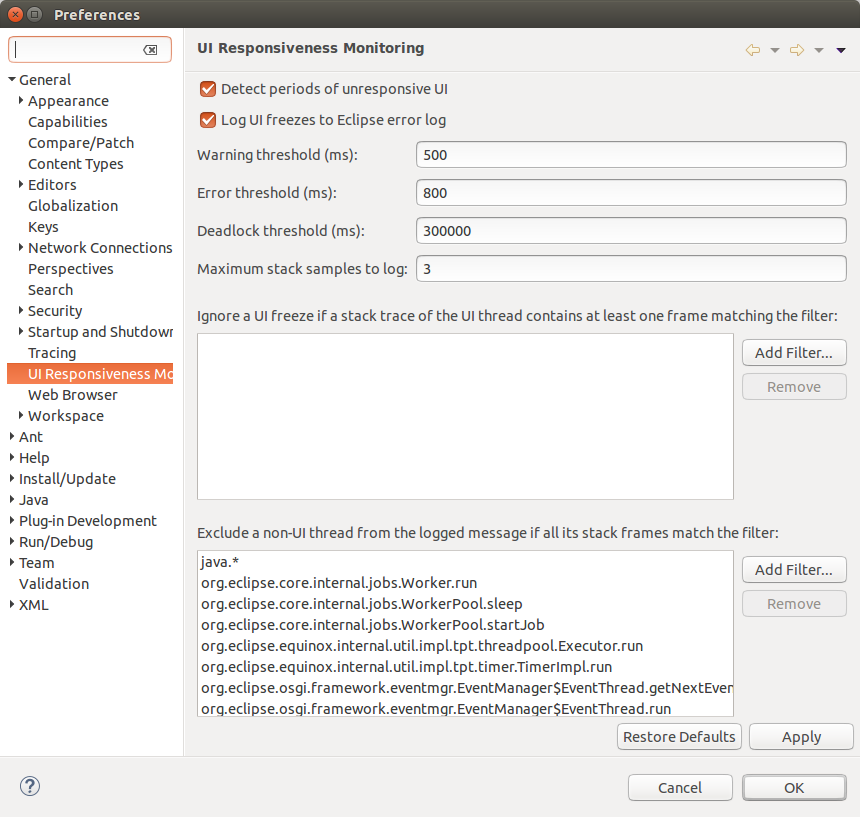
If activated, a stack trace is written to the Error view, in case a UI freeze occurs.
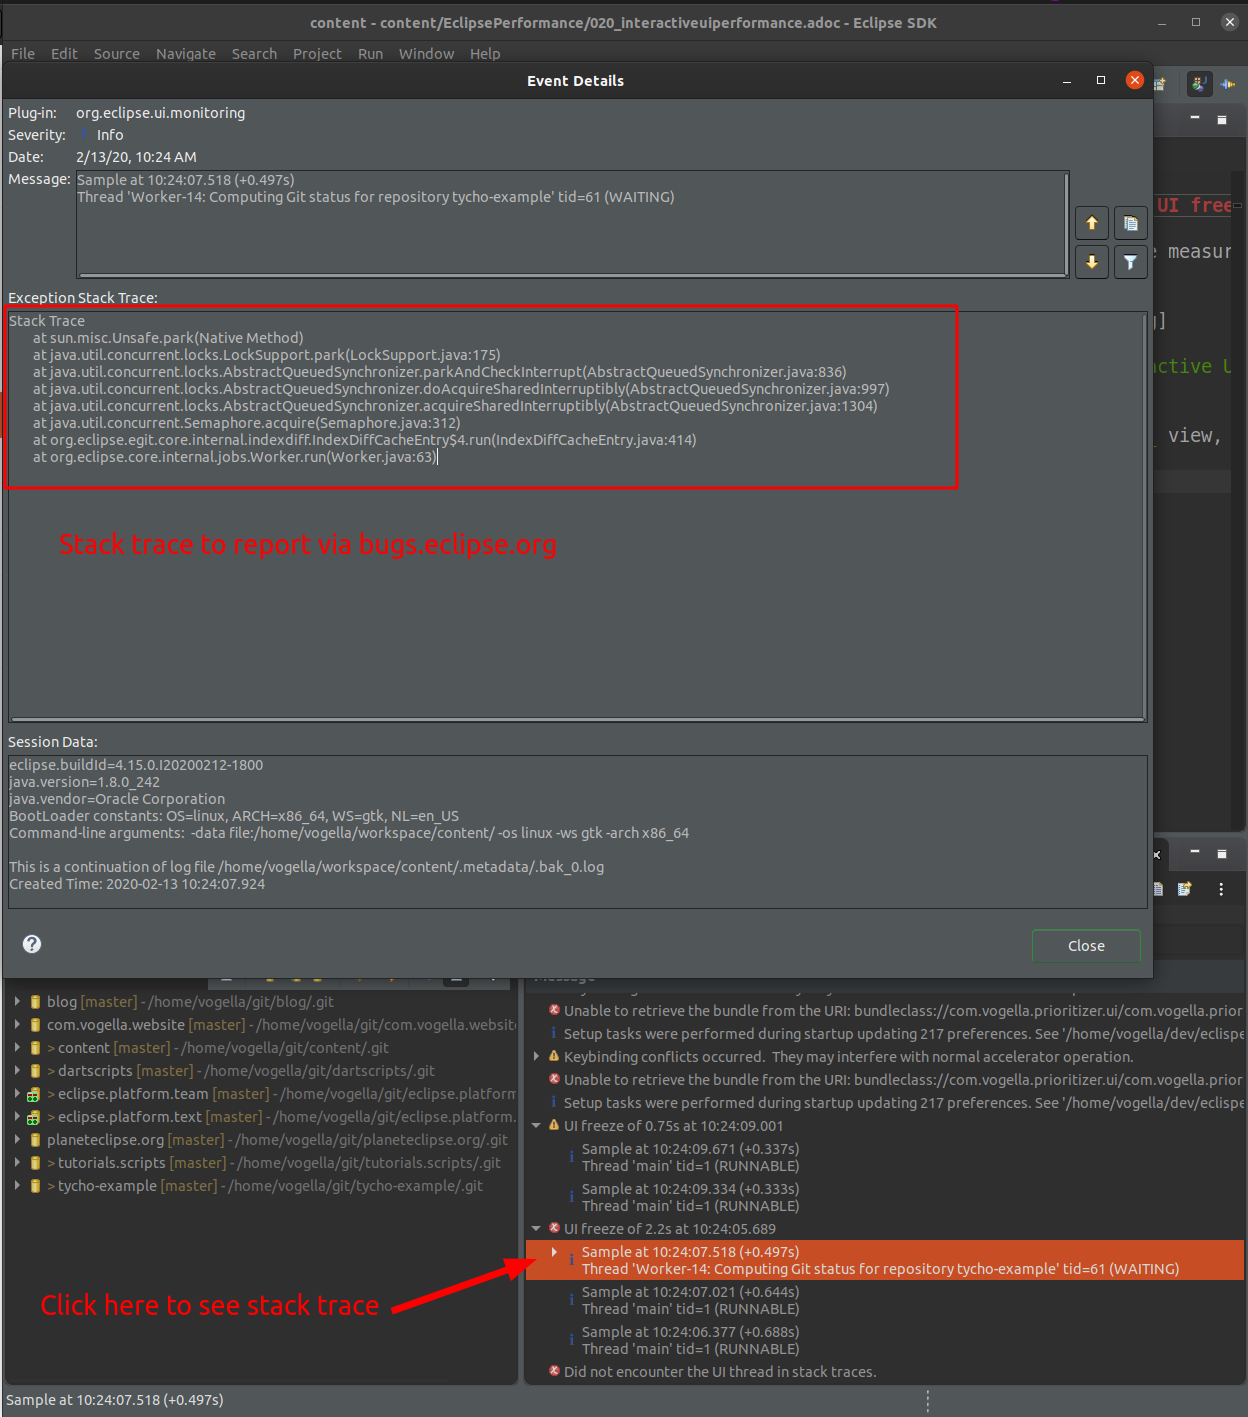
You should report such freezes to https://bugs.eclipse.org/ to that the team can fix these.
3. Using the build-in tracing facilities of Eclipse
3.1. Using tracing for your IDE
Eclipse provides a tracing facility that can be activated on demand. If activated, additional plug-in informations are written to the console at runtime.
You activate tracing via the -debug start parameter.
Eclipse looks now, by default, for a file called .options in the Eclipse install directory.
The file must contain one key=value pair per line.
If the plug-in prepared that you can see the tracing option in the preference settings. It is possible to active these tracing options at runtime. The Eclipse IDE preferences as depicted in the following screenshot.
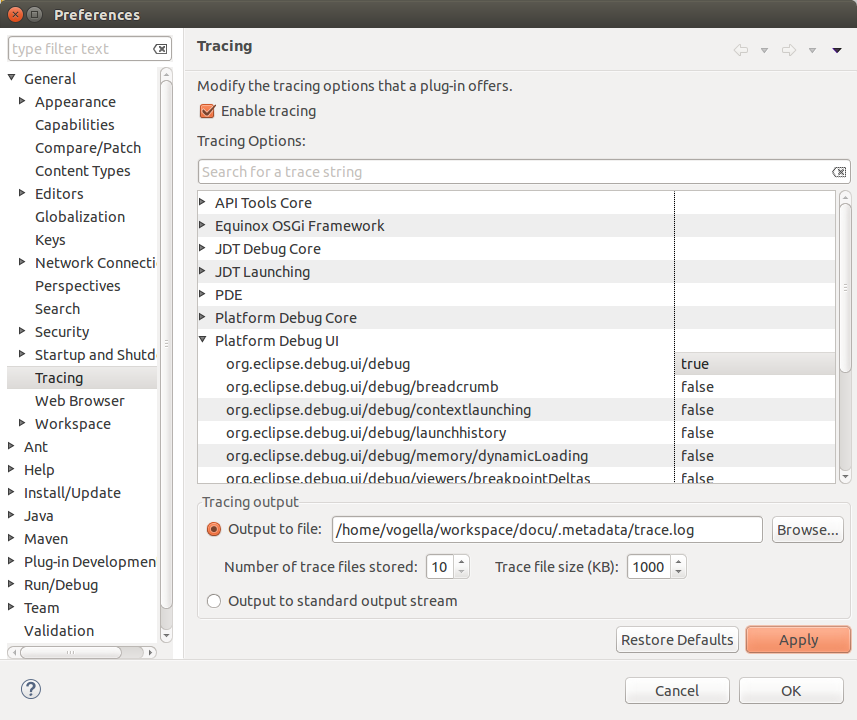
These tracing options are available for a launch configuration.
3.2. Example: Tracing the startup time of plug-ins
In this example, you will trace the start time of each plug-in during startup.
For this, create a .options in your Eclipse installation directory with the following content.
# turn on debugging for the org.eclipse.core plugin.
org.eclipse.osgi/debug=true
# turn on execution time of the activator for the plug-ins
org.eclipse.osgi/debug/bundleTime=true
# turn on total execution time of the plug-ins
org.eclipse.osgi/debug/bundleStartTime=true
Start Eclipse via the following command line.
./eclipse -debug|
You can specify the location of the options file as a URL or a file-system path after the -debug argument. |
In this example, the Starting application timestamp describes when OSGi is done with its initialization. The Application Started tells you when the application has been started. Afterwards, you can extract the information which interest you the most. For the above example, the following is a small shell script this extracts the time of the activator of each bundle . It sorts the bundles by this time.
# start Eclipse with at test workspace while piping the output into a file
./eclipse -debug -data ~/test > trace.txt
# get total start time
echo "Total startup time" > tracefinal.txt
grep "for total start time" trace.txt  | awk '{print $1 " " $13}' |sort -nr >> tracefinal.txt
echo "" >> tracefinal.txt
echo "Activator times" >> tracefinal.txt
# extract the activation time
grep "to load and start the activator" trace.txt  |awk '{print $1 " " $10}'| sort -nr >> tracefinal.txt
3.2.1. Example: Tracing the resource plug-in
The following is another example for an .option file in which you trace the resources.
# turn on debugging for the org.eclipse.core.resources plugin.
org.eclipse.core.resources/debug=true

# monitor builders and gather time statistics etc.
org.eclipse.core.resources/perf/builders=10000

# monitor resource change listeners and gather time statistics etc.
org.eclipse.core.resources/perf/listeners=500

# monitor workspace snapshot and gather time statistics etc.
org.eclipse.core.resources/perf/snapshot=1000

# monitor workspace snapshot and gather time statistics etc.
org.eclipse.core.resources/perf/save.participants=500

# debug build failure cases such as failure to retrieve deltas.
org.eclipse.core.resources/build/failure=true

# reports the cause of autobuild interruption
org.eclipse.core.resources/build/interrupt=true

# reports the start and end of all builder invocations
org.eclipse.core.resources/build/invoking=true

# reports the start and end of build delta calculations
org.eclipse.core.resources/build/delta=true

# for incremental builds, displays which builder is being run
# and because of changes in which project.
org.eclipse.core.resources/build/needbuild=true

# prints a stack trace every time an operation finishes that requires a
build
org.eclipse.core.resources/build/needbuildstack=true

# prints a stack trace every time a build API method is called
org.eclipse.core.resources/build/stacktrace=false

# report debug of workspace auto-refresh
org.eclipse.core.resources/refresh=true
3.2.2. Implement tracing for your plug-in
Can you implement tracing for your custom plug-in, see
Using Eclipse Tracing API. To add your tracing options to the preference page, to allow users to turn them on at run time, use
extension point the org.eclipse.ui.trace.traceComponents.
See TracingPreferencePage for the implementation of this.
3.2.3. Example: Tracing for key bindings
The tracing functionality of Eclipse allows to you trace which command is associated with a certain key binding. The following listing contains the trace options to enable that.
# turn on debugging for the org.eclipse.core.resources plugin.
org.eclipse.ui/debug=true
org.eclipse.ui/trace/keyBindings
org.eclipse.ui/trace/keyBindings.verbose
4. Finding UI freezes by sampling thread dumps
4.1. Why one thread dump is not enough
If the IDE freezes, the obvious reaction is to take a single thread dump with jstack or jcmd and read the main thread, which is the UI thread.
That tells you what the UI thread was doing at one instant, and nothing about how long it stayed there.
A frame that looks alarming may be a fast call you happened to catch, and the real cost may sit in a caller that appears in every dump.
Taking many dumps in a row solves this. If the same call appears in twenty consecutive samples, it is the freeze. If it appears once, it is noise. This is the poor man’s profiler, and for a freeze that lasts seconds it is as good as a real profiler while needing nothing but a JDK.
Reading the leaf frames tells you which kind of problem you have.
Leaf frames that keep changing while a caller stays put mean the code is grinding through work, for example resolving a target platform.
A leaf frame that never changes means the thread is blocked, and the - locked lines in the dump tell you on which monitors.
4.2. Prerequisites
You need a JDK, which the JVM that runs your IDE already provides.
If jcmd is not on the PATH, use the absolute path to the JVM named by the -vm entry in your eclipse.ini.
The scripts below exist in a Windows and a Linux version with the same options and the same output format. Both assume exactly one running Eclipse, so that the process id is unambiguous.
|
Do not paste multi-line PowerShell blocks into the console. A blank line inside an open block ends the input early and the remaining lines produce syntax errors. Save the scripts to a file and run the file. |
4.3. Sampling a full IDE startup on Windows
The following script starts Eclipse, samples one thread while it comes up, writes every dump to a file and prints a summary.
Save it as profile-eclipse-startup.ps1.
# Poor man's profiler for Eclipse startup on Windows.
# Samples one thread with "jcmd Thread.print" and prints a summary.
[CmdletBinding()]
param(
    [string]$EclipseExe = (Join-Path $PWD 'eclipse.exe'),
    [string]$Data,
    [int]$DurationSec = 25,
    [int]$IntervalMs = 250,
    [string]$Out = (Join-Path $PWD 'eclipse-startup-stacks.txt'),
    [string]$Thread = 'main',
    [int]$TargetPid = 0,
    [int]$UntilMs = 0,
    [string]$JcmdExe = 'jcmd',
    [switch]$StopAfter,
    [switch]$AnalyzeOnly,
    [string]$Filter = 'org\.eclipse\.(pde|jdt|ui|e4|core|team|search|debug|ant|equinox\.p2)'
)

$ErrorActionPreference = 'Stop'

function Test-IsDescendant {
    param([int]$ChildPid, [int]$AncestorPid)
    $p = $ChildPid
    for ($i = 0; $i -lt 20 -and $p -gt 0; $i++) {
        if ($p -eq $AncestorPid) { return $true }
        $proc = Get-CimInstance Win32_Process -Filter "ProcessId=$p" -ErrorAction SilentlyContinue
        if (-not $proc) { return $false }
        $p = [int]$proc.ParentProcessId
    }
    return $false
}

# With a -vm entry the launcher forks a child, so the started pid is not always the JVM.
function Get-JvmPid {
    param([int]$RootPid)
    $deadline = (Get-Date).AddSeconds(30)
    while ((Get-Date) -lt $deadline) {
        $candidates = @()
        foreach ($line in (& $JcmdExe -l 2>$null)) {
            if ($line -match '^(\d+)\s+(.*)$' -and $Matches[2] -match 'equinox\.launcher') {
                $candidates += [int]$Matches[1]
            }
        }
        if ($candidates.Count -eq 1) { return $candidates[0] }
        foreach ($c in $candidates) {
            if ($c -eq $RootPid -or (Test-IsDescendant -ChildPid $c -AncestorPid $RootPid)) { return $c }
        }
        Start-Sleep -Milliseconds 100
    }
    return 0
}

function Get-ThreadStacks {
    param([string]$File, [string]$ThreadName, [int]$Until = 0)

    $stacks = New-Object System.Collections.ArrayList
    $prefix = '"' + $ThreadName
    $cur = $null
    $label = ''
    $state = ''
    $skip = $false

    foreach ($line in [System.IO.File]::ReadLines($File)) {
        if ($line.StartsWith('===== sample ')) {
            if ($null -ne $cur -and $cur.Count -gt 0) {
                [void]$stacks.Add([pscustomobject]@{ Label = $label; State = $state; Frames = $cur })
            }
            $cur = $null
            $label = ($line -replace '=', '').Trim()
            $skip = $false
            if ($Until -gt 0 -and $label -match 't(\d+)ms') {
                $skip = ([int]$Matches[1] -gt $Until)
            }
            continue
        }
        if ($skip) { continue }
        # Prefix match, so -Thread "Start Level" matches its per run UUID name.
        if ($line.StartsWith($prefix)) {
            $cur = New-Object System.Collections.ArrayList
            $state = ''
            continue
        }
        if ($null -ne $cur) {
            $t = $line.Trim()
            if ($t -eq '') {
                if ($cur.Count -gt 0) {
                    [void]$stacks.Add([pscustomobject]@{ Label = $label; State = $state; Frames = $cur })
                }
                $cur = $null
                continue
            }
            if ($t.StartsWith('java.lang.Thread.State:')) {
                $state = ($t -split '\s+')[1]
                continue
            }
            if ($t.StartsWith('at ')) { [void]$cur.Add($t) }
        }
    }
    if ($null -ne $cur -and $cur.Count -gt 0) {
        [void]$stacks.Add([pscustomobject]@{ Label = $label; State = $state; Frames = $cur })
    }
    return , $stacks
}

function Show-Summary {
    param($Stacks, [string]$ThreadName, [string]$FilterRegex)

    if (-not $Stacks -or $Stacks.Count -eq 0) {
        Write-Warning "No `"$ThreadName`" stacks found"
        return
    }

    $idleRe = 'Display\.sleep|eventLoopIdle|Display\.readAndDispatch'
    $idle = @($Stacks | Where-Object { ($_.Frames -join "`n") -match $idleRe }).Count
    $busy = $Stacks.Count - $idle

    Write-Host ""
    Write-Host "$($Stacks.Count) samples of the `"$ThreadName`" thread: $busy busy, $idle in the event loop"

    Write-Host ""
    Write-Host "Timeline:"
    foreach ($s in $Stacks) {
        $frame = $s.Frames | Where-Object { $_ -match $FilterRegex } | Select-Object -First 1
        if (-not $frame) { $frame = $s.Frames[0] }
        "{0,-24} {1,-9} {2}" -f $s.Label, $s.State, $frame
    }

    Write-Host ""
    Write-Host "Most frequent triggering frame:"
    $Stacks | ForEach-Object {
        $f = $_.Frames | Where-Object { $_ -match $FilterRegex } | Select-Object -First 1
        if ($f) { $f } else { '(no Eclipse frame)' }
    } | Group-Object | Sort-Object Count -Descending | Select-Object -First 15 |
        Format-Table Count, Name -AutoSize

    Write-Host "Hottest leaf frames:"
    $Stacks | ForEach-Object { $_.Frames[0] } |
        Group-Object | Sort-Object Count -Descending | Select-Object -First 15 |
        Format-Table Count, Name -AutoSize

    Write-Host "Frames by number of samples that contain them (inclusive cost):"
    $threshold = [Math]::Ceiling($Stacks.Count * 0.15)
    $Stacks | ForEach-Object { $_.Frames | Select-Object -Unique } |
        Group-Object | Where-Object { $_.Count -ge $threshold } |
        Sort-Object Count -Descending | Select-Object -First 40 |
        Format-Table Count, Name -AutoSize
}

if ($AnalyzeOnly) {
    if (-not (Test-Path $Out)) { throw "No such file: $Out" }
    Show-Summary -Stacks (Get-ThreadStacks -File $Out -ThreadName $Thread -Until $UntilMs) `
        -ThreadName $Thread -FilterRegex $Filter
    return
}

$launched = $null
if ($TargetPid -gt 0) {
    $jvmPid = $TargetPid
} else {
    if (-not (Test-Path $EclipseExe)) {
        throw "No such Eclipse launcher: $EclipseExe. Pass -EclipseExe <path>."
    }
    if (Get-Process eclipse -ErrorAction SilentlyContinue) {
        throw "An eclipse process is already running, close it first (or pass -TargetPid)."
    }

    $outDir = Split-Path -Parent $Out
    if ($outDir -and -not (Test-Path $outDir)) {
        New-Item -ItemType Directory -Path $outDir -Force | Out-Null
    }
    Remove-Item $Out -ErrorAction SilentlyContinue
    Write-Host "Writing stacks to $Out"

    $launchArgs = @()
    if ($Data) { $launchArgs += @('-data', $Data) }
    $launched = if ($launchArgs.Count) {
        Start-Process -FilePath $EclipseExe -ArgumentList $launchArgs -PassThru
    } else {
        Start-Process -FilePath $EclipseExe -PassThru
    }

    $jvmPid = Get-JvmPid -RootPid $launched.Id
    if ($jvmPid -eq 0) {
        throw "Could not find the JVM process for launcher $($launched.Id)."
    }
    Write-Host "Launcher PID $($launched.Id), JVM PID $jvmPid"
}

Write-Host "Sampling for $DurationSec s every $IntervalMs ms via jcmd"

$sw = [System.Diagnostics.Stopwatch]::StartNew()
$n = 0
$captured = 0
while ($sw.Elapsed.TotalSeconds -lt $DurationSec) {
    if ($launched -and $launched.HasExited) {
        Write-Warning "eclipse exited after $([int]$sw.Elapsed.TotalSeconds) s"
        break
    }
    $n++
    $dump = & $JcmdExe $jvmPid Thread.print 2>&1
    if ($LASTEXITCODE -eq 0) {
        $captured++
        "===== sample $n t=$([int]$sw.Elapsed.TotalMilliseconds)ms =====" | Add-Content $Out -Encoding utf8
        $dump | Add-Content $Out -Encoding utf8
    }
    Start-Sleep -Milliseconds $IntervalMs
}

Write-Host "$captured of $n sampling attempts succeeded"
if ($captured -eq 0) {
    Write-Warning "Could not attach. Check whether the JVM runs in a separate process: Get-Process java,javaw"
    return
}

if ($StopAfter -and $launched) {
    Stop-Process -Id $jvmPid -ErrorAction SilentlyContinue
}

Show-Summary -Stacks (Get-ThreadStacks -File $Out -ThreadName $Thread -Until $UntilMs) `
    -ThreadName $Thread -FilterRegex $Filter
Run it with the installation and the workspace you want to investigate.
powershell -ExecutionPolicy Bypass -File .\profile-eclipse-startup.ps1 `
    -EclipseExe "C:\eclipse\eclipse.exe" -Data "C:\ws\my-workspace"
4.4. Sampling a full IDE startup on Linux
Windows has no SIGQUIT, so the PowerShell version calls jcmd Thread.print once per sample.
Each jcmd call starts its own JVM, which costs roughly 80 to 250 ms, so on a startup that finishes in a few seconds the sampler itself sets the resolution floor.
On Linux you can do better.
kill -QUIT makes the JVM print the dump to its own stdout, which costs the sampler nothing and allows a 50 ms interval.
The script below redirects the launcher’s stdout, records a millisecond timestamp per signal, and then rewrites the JVM output into the same ===== sample N t=NNNNms ===== format that the jcmd path produces, so both platforms feed the same analysis code.
Save it as profile-eclipse-startup.sh.
#!/usr/bin/env bash
# Poor man's profiler for Eclipse startup on Linux.
# Samples one thread via SIGQUIT and prints a summary.
set -uo pipefail

HERE="$(cd "$(dirname "${BASH_SOURCE[0]}")" && pwd)"

ECLIPSE="$PWD/eclipse"
DATA=""
DURATION_SEC=25
INTERVAL_MS=50
OUT="$PWD/eclipse-startup-stacks.txt"
THREAD="main"
METHOD="sigquit"
ATTACH_PID=""
STOP_AFTER=0
ANALYZE_ONLY=0
UNTIL_MS=0
FILTER='org[.]eclipse[.](pde|jdt|ui|e4|core|team|search|debug|ant|equinox\.p2)'

usage() {
    cat <<'EOF'
Usage: profile-eclipse-startup.sh [options]

  --data DIR         workspace passed as -data (recommended)
  --eclipse PATH     launcher to start (default: ./eclipse in the current directory)
  --duration SEC     how long to sample (default 25)
  --interval MS      delay between samples (default 50)
  --out FILE         where to write the dumps (default ./eclipse-startup-stacks.txt)
  --thread NAME      thread to summarize (default main, the SWT UI thread)
  --method M         sigquit (default, cheap) or jcmd (portable, ~150 ms per sample)
  --pid PID          sample a running JVM instead of starting one (forces --method jcmd)
  --stop-after       terminate Eclipse once the sampling window ends
  --analyze-only     re-print the summary for an existing --out file
  --until MS         only analyze samples taken before this timestamp (0 = all)
  --filter REGEX     regex for the "triggering frame" (default: Eclipse UI/core code)
EOF
}

while [ $# -gt 0 ]; do
    case "$1" in
    --data) DATA="$2"; shift 2 ;;
    --eclipse) ECLIPSE="$2"; shift 2 ;;
    --duration) DURATION_SEC="$2"; shift 2 ;;
    --interval) INTERVAL_MS="$2"; shift 2 ;;
    --out) OUT="$2"; shift 2 ;;
    --thread) THREAD="$2"; shift 2 ;;
    --method) METHOD="$2"; shift 2 ;;
    --pid) ATTACH_PID="$2"; METHOD="jcmd"; shift 2 ;;
    --filter) FILTER="$2"; shift 2 ;;
    --stop-after) STOP_AFTER=1; shift ;;
    --analyze-only) ANALYZE_ONLY=1; shift ;;
    --until) UNTIL_MS="$2"; shift 2 ;;
    -h | --help) usage; exit 0 ;;
    *) echo "Unknown option: $1" >&2; usage >&2; exit 2 ;;
    esac
done

now_ms() { echo $(($(date +%s%N) / 1000000)); }

# The launcher either loads the JVM in process or forks a java child.
is_jvm() { grep -qa 'libjvm\.so' "/proc/$1/maps" 2>/dev/null; }

find_jvm_pid() {
    local root="$1" deadline p c
    deadline=$(($(now_ms) + 30000))
    while [ "$(now_ms)" -lt "$deadline" ]; do
        kill -0 "$root" 2>/dev/null || return 1
        for p in "$root" $(pgrep -P "$root" 2>/dev/null); do
            is_jvm "$p" && { echo "$p"; return 0; }
            for c in $(pgrep -P "$p" 2>/dev/null); do
                is_jvm "$c" && { echo "$c"; return 0; }
            done
        done
        sleep 0.02
    done
    return 1
}

# Matches process name plus argv, so a shell mentioning equinox.launcher never self-matches.
running_eclipse_jvms() {
    local p
    for p in $(pgrep -x java 2>/dev/null; pgrep -x eclipse 2>/dev/null); do
        is_jvm "$p" || continue
        tr '\0' ' ' <"/proc/$p/cmdline" 2>/dev/null | grep -q 'equinox\.launcher' && echo "$p"
    done
}

# jcmd from the JDK that actually runs Eclipse, so attach versions always match.
resolve_jcmd() {
    local pid="$1" home
    home="$(dirname "$(dirname "$(readlink -f "/proc/$pid/exe" 2>/dev/null)")")"
    if [ -x "$home/bin/jcmd" ]; then echo "$home/bin/jcmd"; return 0; fi
    command -v jcmd 2>/dev/null && return 0
    return 1
}

analyze() {
    local file="$1"
    [ -s "$file" ] || { echo "No samples in $file" >&2; return 1; }
    local tmp
    tmp="$(mktemp -d)"
    trap 'rm -rf "$tmp"' RETURN

    awk -v thread="$THREAD" -v filter="$FILTER" -v until_ms="$UNTIL_MS" \
        -v tlf="$tmp/timeline" -v leaff="$tmp/leaf" \
        -v trigf="$tmp/trig" -v inclf="$tmp/incl" -v statf="$tmp/stat" '
    function flush(   i, trig, tl, idle) {
        if (nfr > 0) {
            nvalid++
            print fr[1] > leaff
            trig = ""
            for (i = 1; i <= nfr; i++) if (fr[i] ~ filter) { trig = fr[i]; break }
            print (trig == "" ? "(no Eclipse frame)" : trig) > trigf
            tl = (trig == "" ? fr[1] : trig)
            printf "%-24s %-9s %s\n", label, state, tl > tlf
            delete seen
            for (i = 1; i <= nfr; i++)
                if (!(fr[i] in seen)) { seen[fr[i]] = 1; print fr[i] > inclf }
            idle = 0
            for (i = 1; i <= nfr; i++)
                if (fr[i] ~ /Display\.sleep|eventLoopIdle|Display\.readAndDispatch/) idle = 1
            print (idle ? "idle" : "busy") > statf
        }
        nfr = 0; state = ""
    }
    /^===== sample / {
        flush()
        label = $0; gsub(/=/, "", label); sub(/^ +/, "", label); sub(/ +$/, "", label)
        t = label; sub(/.*t/, "", t); sub(/ms.*/, "", t)
        skip = (until_ms > 0 && t + 0 > until_ms)
        inthr = 0; next
    }
    {
        # Prefix match, so --thread "Start Level" matches its per run UUID name.
        if (substr($0, 1, length(thread) + 1) == "\"" thread) {
            inthr = 1; nfr = 0; state = ""; next
        }
    }
    inthr == 1 && !skip {
        line = $0; sub(/^[ \t]+/, "", line); sub(/[ \t]+$/, "", line)
        if (line == "") { flush(); inthr = 0; next }
        if (line ~ /^java\.lang\.Thread\.State:/) { split(line, a, " "); state = a[2]; next }
        if (line ~ /^at /) fr[++nfr] = line
    }
    END { flush(); print nvalid > (tlf ".count") }
    ' "$file"

    local n busy idle
    n=$(cat "$tmp/timeline.count" 2>/dev/null || echo 0)
    [ "$n" -gt 0 ] || { echo "No \"$THREAD\" stacks found in $file" >&2; return 1; }
    busy=$(grep -c '^busy$' "$tmp/stat" 2>/dev/null || true)
    idle=$(grep -c '^idle$' "$tmp/stat" 2>/dev/null || true)

    echo
    echo "$n samples of the \"$THREAD\" thread: ${busy:-0} busy, ${idle:-0} in the event loop"
    echo
    echo "Timeline:"
    cat "$tmp/timeline"
    echo
    echo "Most frequent triggering frame:"
    sort "$tmp/trig" | uniq -c | sort -rn | head -15
    echo
    echo "Hottest leaf frames:"
    sort "$tmp/leaf" | uniq -c | sort -rn | head -15
    echo
    echo "Frames by number of samples that contain them (inclusive cost):"
    sort "$tmp/incl" | uniq -c | sort -rn | awk -v n="$n" '$1 >= n * 0.15' | head -40
}

if [ "$ANALYZE_ONLY" = "1" ]; then
    analyze "$OUT"
    exit $?
fi

if [ -n "$ATTACH_PID" ]; then
    JVM_PID="$ATTACH_PID"
    is_jvm "$JVM_PID" || { echo "PID $JVM_PID is not a JVM" >&2; exit 1; }
    LAUNCH_PID=""
    T0=$(now_ms)
else
    [ -x "$ECLIPSE" ] || {
        echo "Not an executable Eclipse launcher: $ECLIPSE" >&2
        echo "Pass --eclipse /path/to/eclipse" >&2
        exit 1
    }
    if [ -n "$(running_eclipse_jvms)" ]; then
        echo "An Eclipse is already running, close it first (or pass --pid)." >&2
        exit 1
    fi
    # $OUT supersedes the raw stdout, so drop it after conversion.
    LOG="$(mktemp)"
    echo "Writing stacks to $OUT"
    T0=$(now_ms)
    if [ -n "$DATA" ]; then
        "$ECLIPSE" -data "$DATA" >"$LOG" 2>&1 &
    else
        "$ECLIPSE" >"$LOG" 2>&1 &
    fi
    LAUNCH_PID=$!
    JVM_PID="$(find_jvm_pid "$LAUNCH_PID")" || {
        echo "Could not find the JVM process for launcher $LAUNCH_PID" >&2
        exit 1
    }
    echo "Launcher PID $LAUNCH_PID, JVM PID $JVM_PID, found after $(($(now_ms) - T0)) ms"
fi

echo "Sampling for ${DURATION_SEC}s every ${INTERVAL_MS}ms via $METHOD"

END_MS=$((T0 + DURATION_SEC * 1000))
SLEEP=$(awk -v ms="$INTERVAL_MS" 'BEGIN { printf "%.3f", ms / 1000 }')
N=0
CAPTURED=0

if [ "$METHOD" = "jcmd" ]; then
    JCMD="$(resolve_jcmd "$JVM_PID")" || { echo "No jcmd found" >&2; exit 1; }
    : >"$OUT"
    while [ "$(now_ms)" -lt "$END_MS" ]; do
        kill -0 "$JVM_PID" 2>/dev/null || { echo "JVM exited after $(($(now_ms) - T0)) ms"; break; }
        N=$((N + 1))
        if DUMP="$("$JCMD" "$JVM_PID" Thread.print 2>&1)"; then
            CAPTURED=$((CAPTURED + 1))
            printf '===== sample %d t=%dms =====\n%s\n' "$N" "$(($(now_ms) - T0))" "$DUMP" >>"$OUT"
        fi
        sleep "$SLEEP"
    done
else
    # SIGQUIT prints the dump to the JVM's own stdout, costing the sampler nothing.
    TIMES="$(mktemp)"
    while [ "$(now_ms)" -lt "$END_MS" ]; do
        kill -0 "$JVM_PID" 2>/dev/null || { echo "JVM exited after $(($(now_ms) - T0)) ms"; break; }
        N=$((N + 1))
        if kill -QUIT "$JVM_PID" 2>/dev/null; then
            CAPTURED=$((CAPTURED + 1))
            echo "$(($(now_ms) - T0))" >>"$TIMES"
        fi
        sleep "$SLEEP"
    done
    sleep 0.5 # let the last dump finish flushing
    # The Nth "Full thread dump" belongs to the Nth signal we sent.
    awk -v times="$TIMES" -v out="$OUT" '
    BEGIN { while ((getline t < times) > 0) ts[++nt] = t; printf "" > out }
    /^Full thread dump / { n++; printf "===== sample %d t=%sms =====\n", n, (n <= nt ? ts[n] : "?") >> out }
    n > 0 { print >> out }
    ' "$LOG"
    rm -f "$TIMES" "$LOG"
fi

echo "$CAPTURED of $N sampling attempts succeeded"
[ "$CAPTURED" -gt 0 ] || { echo "Nothing captured." >&2; exit 1; }

if [ "$STOP_AFTER" = "1" ] && [ -n "${LAUNCH_PID:-}" ]; then
    kill -TERM "$JVM_PID" 2>/dev/null
fi

analyze "$OUT"
./profile-eclipse-startup.sh --eclipse /path/to/eclipse --data ~/workspace/platform--method jcmd is still available on Linux and is required together with --pid, because the stdout of a process that the script did not start cannot be captured.
Sampling every 50 ms costs roughly 10 percent in measured startup time. In one comparison the UI thread first reached the event loop after 5646 ms at a 50 ms interval and after 5087 ms at a 250 ms interval. Cross-check anything important at a coarser interval before you trust an absolute number.
4.5. What the summary prints
Both versions print four sections.
The timeline shows one line per sample with the elapsed time, the thread state and the most interesting frame. This is the primary signal: a stall appears as a run of identical lines.
The triggering frame table counts which UI code led into the expensive work.
The leaf frame table shows where the time was actually burned.
The inclusive cost table ranks frames by how many samples contain them anywhere in the stack. Read down that list, because the deepest frame with a high count is the expensive subtree.
Use --until respectively -UntilMs to restrict all four sections to the startup window.
Without it the idle event loop after startup dominates every table.
4.6. Reading the full stack of a sample
The summary deliberately prints one frame per sample so that the timeline stays readable. Once you know which sample interests you, this second script prints its complete stack.
# Prints the full thread stack of the samples matching a regular expression.
# Companion to profile-eclipse-startup.ps1.
[CmdletBinding()]
param(
    [string]$File = (Join-Path $PWD 'eclipse-startup-stacks.txt'),
    [string]$Match = 'AbstractBundleContainer\.resolve',
    [int]$Count = 1,
    [string]$Thread = 'main'
)

$ErrorActionPreference = 'Stop'

if (-not (Test-Path $File)) { throw "No such file: $File" }

$stacks = New-Object System.Collections.ArrayList
$prefix = '"' + $Thread
$cur = $null
$label = ''
$state = ''

foreach ($line in [System.IO.File]::ReadLines($File)) {
    if ($line.StartsWith('===== sample ')) {
        if ($null -ne $cur -and $cur.Count -gt 0) {
            [void]$stacks.Add([pscustomobject]@{ Label = $label; State = $state; Frames = $cur })
        }
        $cur = $null
        $label = ($line -replace '=', '').Trim()
        continue
    }
    # Prefix match, so -Thread "Start Level" matches its per run UUID name.
    if ($line.StartsWith($prefix)) {
        $cur = New-Object System.Collections.ArrayList
        $state = ''
        continue
    }
    if ($null -ne $cur) {
        $t = $line.Trim()
        if ($t -eq '') {
            if ($cur.Count -gt 0) {
                [void]$stacks.Add([pscustomobject]@{ Label = $label; State = $state; Frames = $cur })
            }
            $cur = $null
            continue
        }
        if ($t.StartsWith('java.lang.Thread.State:')) {
            $state = ($t -split '\s+')[1]
            continue
        }
        if ($t.StartsWith('at ')) { [void]$cur.Add($t) }
    }
}
if ($null -ne $cur -and $cur.Count -gt 0) {
    [void]$stacks.Add([pscustomobject]@{ Label = $label; State = $state; Frames = $cur })
}

$hits = @($stacks | Where-Object { ($_.Frames -join "`n") -match $Match })
Write-Host "$($hits.Count) of $($stacks.Count) samples match '$Match'"

foreach ($s in ($hits | Select-Object -First $Count)) {
    Write-Host ""
    Write-Host "----- $($s.Label) ($($s.State)) -----"
    $s.Frames
}
The Linux version.
#!/usr/bin/env bash
# Prints the full UI thread stack of the samples that match a regex.
# Companion to profile-eclipse-startup.sh, mirrors show-blocking-stack.ps1.
set -uo pipefail

FILE="$PWD/eclipse-startup-stacks.txt"
MATCH="AbstractBundleContainer[.]resolve"
COUNT=1
THREAD="main"

usage() {
    cat <<'EOF'
Usage: show-blocking-stack.sh [options]

  --file FILE     dump file (default ./eclipse-startup-stacks.txt)
  --match REGEX   print samples whose UI stack matches this (default AbstractBundleContainer\.resolve)
  --count N       how many matching samples to print (default 1)
  --thread NAME   thread to print (default main)
EOF
}

while [ $# -gt 0 ]; do
    case "$1" in
    --file) FILE="$2"; shift 2 ;;
    --match) MATCH="$2"; shift 2 ;;
    --count) COUNT="$2"; shift 2 ;;
    --thread) THREAD="$2"; shift 2 ;;
    -h | --help) usage; exit 0 ;;
    *) echo "Unknown option: $1" >&2; usage >&2; exit 2 ;;
    esac
done

[ -f "$FILE" ] || { echo "No such file: $FILE" >&2; exit 1; }

awk -v thread="$THREAD" -v match_re="$MATCH" -v want="$COUNT" '
function flush(   i, hit) {
    if (nfr > 0) {
        total++
        hit = 0
        for (i = 1; i <= nfr; i++) if (fr[i] ~ match_re) { hit = 1; break }
        if (hit) {
            hits++
            if (printed < want) {
                printed++
                out = out "\n----- " label " (" state ") -----\n"
                for (i = 1; i <= nfr; i++) out = out fr[i] "\n"
            }
        }
    }
    nfr = 0; state = ""
}
/^===== sample / {
    flush()
    label = $0; gsub(/=/, "", label); sub(/^ +/, "", label); sub(/ +$/, "", label)
    inthr = 0; next
}
{
    if (substr($0, 1, length(thread) + 1) == "\"" thread) {
        inthr = 1; nfr = 0; state = ""; next
    }
}
inthr == 1 {
    line = $0; sub(/^[ \t]+/, "", line); sub(/[ \t]+$/, "", line)
    if (line == "") { flush(); inthr = 0; next }
    if (line ~ /^java\.lang\.Thread\.State:/) { split(line, a, " "); state = a[2]; next }
    if (line ~ /^at /) fr[++nfr] = line
}
END {
    flush()
    printf "%d of %d samples match \"%s\"\n", hits, total, match_re
    printf "%s", out
}
' "$FILE"
By default it prints the first sample whose stack matches a regular expression.
powershell -ExecutionPolicy Bypass -File .\show-blocking-stack.ps1

# filter for a specific caller instead
.\show-blocking-stack.ps1 -Match 'PDELabelProvider\.getObjectText'

# print two samples, to check the stack is stable rather than progressing
.\show-blocking-stack.ps1 -Count 2
./show-blocking-stack.sh --match 'PDELabelProvider[.]getObjectText' --count 2In Bash prefer a character class such as [.] over \., because a backslash escape inside a string that is handed to awk produces a warning and is treated as a plain dot anyway.
It reports how many samples matched before printing, so a count of zero tells you the filter missed rather than leaving you with an empty result.
4.7. Sampling the right thread
--thread respectively -Thread matches on a prefix, so --thread "Start Level" finds the Equinox thread whose full name carries a per run UUID.
This matters more than it sounds.
Sampling only main can turn the largest block of a startup into a flat idle wait: during the OSGi start level the UI thread parks on a semaphore in EclipseStarter.updateSplash while the actual bundle activation happens on the Start Level thread.
Whenever a stretch of the timeline shows main in TIMED_WAITING, run the analysis again against the thread that is really working.
4.8. Example: an eight second freeze during startup
Sampling an IDE startup every 500 ms produced this timeline.
sample 15 t11544ms   at org.eclipse.ui.internal.e4.compatibility.CompatibilityPart.createPartControl
sample 16 t12308ms   at org.eclipse.pde.internal.ui.editor.PDEProjectionViewer.<init>
sample 17 t13147ms   at org.eclipse.pde.internal.core.target.AbstractBundleContainer.resolve
sample 18 t13984ms   at org.eclipse.pde.internal.core.target.AbstractBundleContainer.resolve
sample 19 t14805ms   at org.eclipse.pde.internal.core.target.AbstractBundleContainer.resolve
...
sample 26 t20495ms   at org.eclipse.pde.internal.core.ExternalFeatureModelManager.createModel
sample 27 t21317ms   at org.eclipse.ui.internal.Workbench.lambda$3
Ten consecutive samples in target platform resolution, roughly eight seconds of frozen UI, and the triggering frame table attributed all of them to a single method. The full stack of sample 17 showed the whole chain: a Category Definition editor restored from the previous session set the input of its tree viewer, the label provider was asked for the text of a feature entry, and answering that required resolving the target platform.
This is worth stating as a rule. A label provider is called on the UI thread for every visible row, so it must never ask a question whose answer can require resolving the target platform. The sampling approach is what turns a vague "the IDE hangs on startup" into that one-sentence diagnosis.
4.9. Example: a startup without a single culprit
Not every startup has one dominant freeze, and the summary tells you that too.
Sampling an Eclipse 4.41 SDK on Linux against a 211 MB platform workspace, four runs at a 50 ms interval, gave a UI thread that first reaches the event loop between 5.1 and 6.1 s and settles between 5.7 and 7.7 s. Of the first seven seconds roughly 4.2 to 4.5 s is UI thread work. The splash appears much earlier, which is what makes such a startup feel faster than it is.
The reproducible blocks were spread out rather than concentrated.
| Cost | What |
|---|---|
800 to 1150 ms |
OSGi start level, with the UI thread parked in |
190 to 320 ms |
|
190 to 250 ms |
|
180 to 260 ms each |
repeated |
The largest block is the one that a naive reading would miss.
For 800 to 1150 ms the UI thread only waits, and re-running the analysis with --thread "Start Level" showed org.apache.felix.scr.impl.Activator$ScrExtension.start as the dominant frame, so declarative services component processing is what to attack.
The inclusive cost table then adds the cross cutting costs, which overlap and therefore do not add up: OSGi class loading 1.4 to 1.5 s, custom tab and frame rendering 0.9 to 1.1 s, SWT image loading 0.5 to 0.8 s, CSS and theme engine 0.5 to 0.6 s.
Following up on the second entry with show-blocking-stack.sh was worthwhile.
Every single sample of Workbench.initializeImages, in every run, was inside SVG rasterization below URLImageDescriptor.createImage, because the product declares windowImages as eclipse16.svg,eclipse32.svg,eclipse48.svg.
Three SVG icons are rasterized on the UI thread before any window exists.
|
A sampling profiler attributes time to whatever is on the stack at the sample instant. Single sample entries are noise, and only repeated blocks are meaningful. Attribution is granular to the sampling interval, so a block reported as 190 ms from three samples is approximate. Every thread dump walks all threads at a safepoint, so the dump files grow quickly. A 25 s run at 50 ms produced 22 MB. |
5. Eclipse tracing and performance tools resources
5.1. vogella Java example code
If you need more assistance we offer Online Training and Onsite training as well as consulting