



Performance optimization in Eclipse based applications
A performance pull request usually comes with an argument, not with a measurement. This post walks through one such PR, shows how we measured it in a running IDE, and what the numbers say about the argument.
The change
The Dependencies page of the PDE manifest editor lists the Import-Package entries of a bundle. For every row the label provider asks whether some bundle in the target platform exports that package, and picks the icon accordingly.
The stock implementation answered that question through State.getExportedPackages().
That method is not cached: every call takes the state monitor and copies the exports of all resolved bundles into a freshly allocated array.
With an SDK sized target platform that is about 3200 exports copied per row, on the UI thread, for every refresh of the table.
eclipse.pde#2444 replaces the copy with a walk over the resolved bundles that reads the exports in place and stops at the first match. The PR description argues with reference stores: roughly 9600 per call before, 731 after.
On the related Equinox change, equinox#1347, the reviewer asked for performance metrics instead: fewer reference stores do not always result in a measurable improvement. That is a fair question, and it needs numbers from a real IDE rather than a microbenchmark.
Setup
Eclipse SDK 4.42 I-build 20260902-2327, stock org.eclipse.osgi 3.24, running headless under Xvfb.
The target platform is the running platform: 850 bundles, about 3200 exported packages.
Before: stock org.eclipse.pde.core 3.21.500.v20260902-1925.
After: org.eclipse.pde.core built from the PR branch, everything else identical, IDE started with -clean.
Two manifests: org.eclipse.equinox.p2.tests with 48 Import-Package rows and a copy of the org.apache.ant manifest with 105 rows.
The table refreshes twice per open, once on creation and once on page activation, so each open is 96 or 210 calls of isResolved().
The scenario, ten iterations per run: close the manifest editor, open META-INF/MANIFEST.MF, switch to the Dependencies page, wait until the UI thread is idle.
Results
| 48 rows before | 48 rows after | 105 rows before | 105 rows after | |
|---|---|---|---|---|
UI thread samples in getExportedPackages / all samples |
5 / 533 | 0 / 529 | 12 / 543 | 0 / 462 |
Estimated UI thread time in isResolved per page open |
about 5 ms | below 1 ms | about 12 ms | below 1 ms |
Allocation per isResolved call |
about 360 KB | about 7 KB | about 220 KB | not sampled |
JFR allocation weight under isResolved, ten opens |
175 MB | 4 MB | 470 MB | none sampled |
| Median switch to the Dependencies page | 68 ms | 66 ms | 57 ms | 55 ms |
| GC events during the run | 0 | 0 | 0 | 0 |
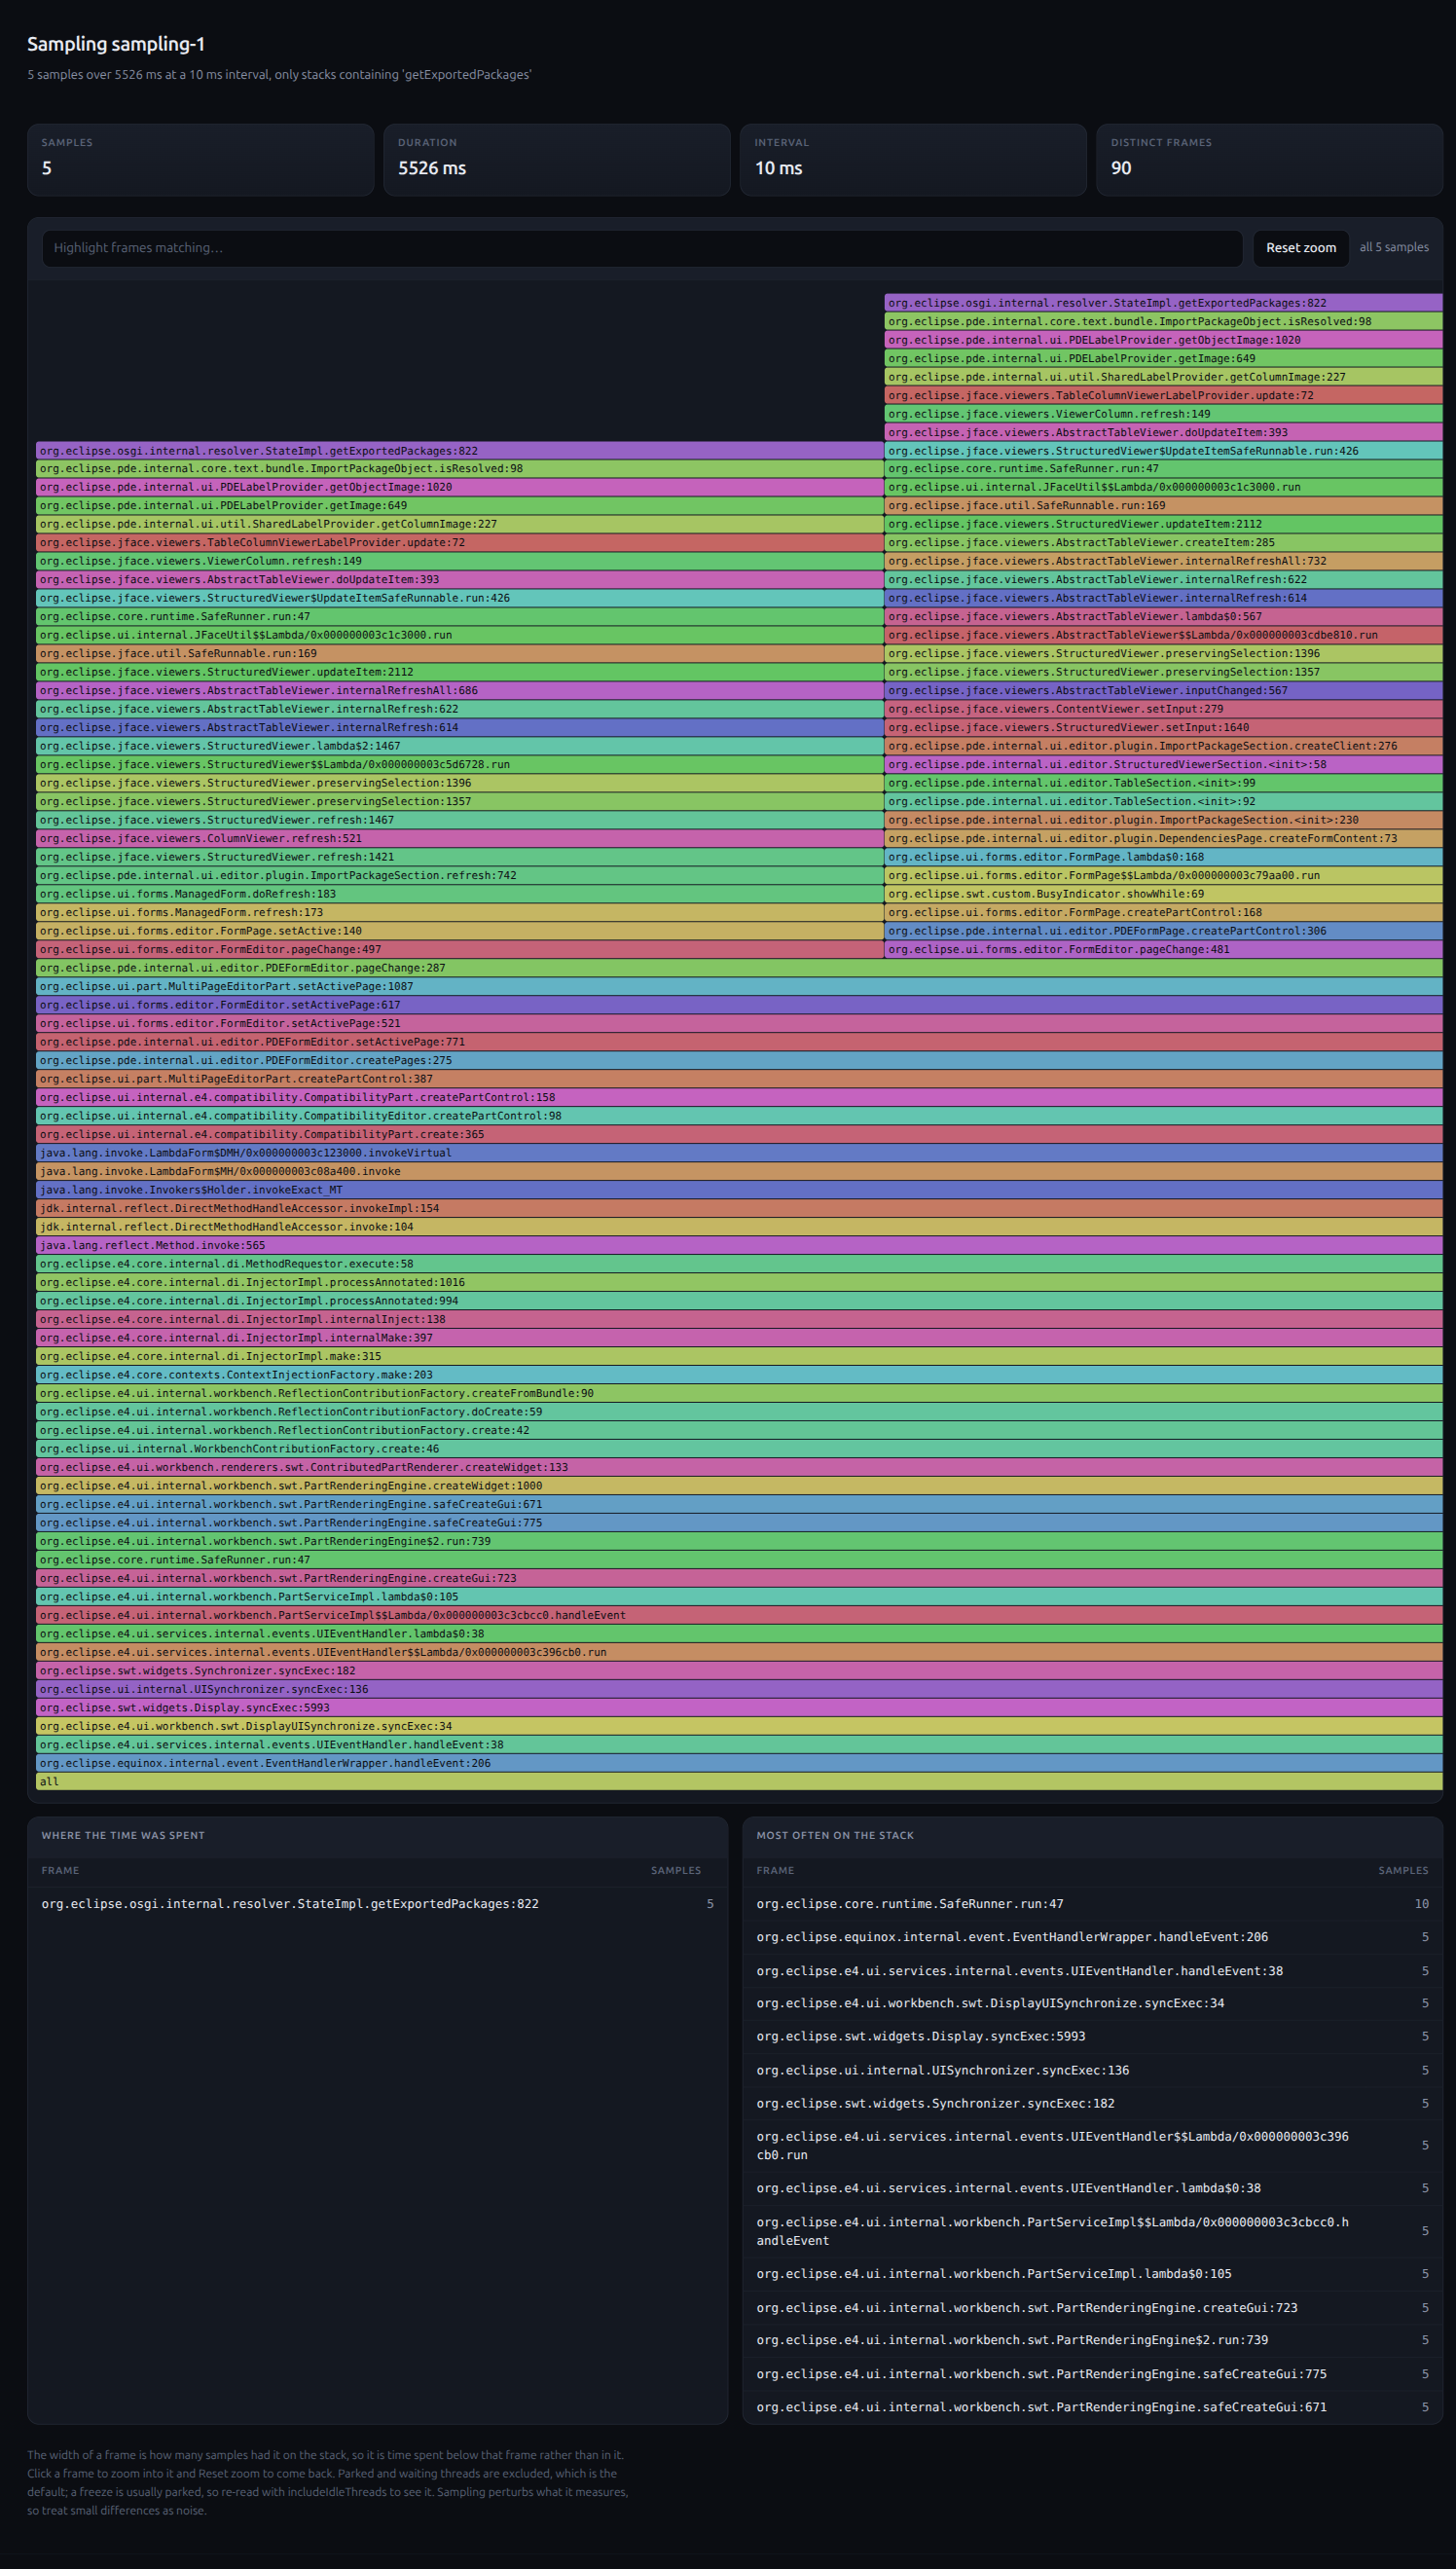
Before the change, every sampled stack is one path: the Dependencies page refreshes its table viewer, the label provider asks for the image, ImportPackageObject.isResolved calls StateImpl.getExportedPackages.
The allocation under it is the fresh ExportPackageDescription[] plus the ArrayList growth that builds it.
After the change the method no longer appears in the 10 ms samples at all.
What JFR still attributes to isResolved is the BundleDescription[] copy returned by State.getResolvedBundles().
What the numbers say
The work and the allocation scale with the row count, as the PR says, and the change removes them. Both are real: a few hundred kilobytes of garbage per row, on every refresh, on the UI thread.
The page does not get measurably faster at 48 or 105 rows. The 5 to 12 ms per open were already below the cost of the page switch itself, and no garbage collection was triggered on either side, so the removed allocation never turned into a pause during these runs. A visible difference would need several hundred imports, or the garbage coinciding with a collection.
So the reviewer’s caution holds up as well as the PR does. The change is an improvement in work done and memory allocated, not a latency win a user would notice on a typical manifest. That is the answer a reviewer asking for metrics needs, and it is a better basis for the discussion than either “fewer reference stores” or “no visible difference” alone.
How we measured
The measurement was driven by an agent through our MCP server for the Eclipse IDE, against the real IDE instead of a benchmark harness.
eclipse_run_script runs the scenario: close the editor, open the manifest, switch to the Dependencies tab, then eclipse_wait_until_settled until the UI thread is idle.
It repeats this ten times and reports the milliseconds per step, which gives the page switch row of the table.
eclipse_start_sampling and eclipse_stop_sampling sample the UI thread at 10 ms.
A frameFilter restricts the result to samples that contain the frame of interest, here getExportedPackages, and eclipse_show_trace renders them as the flame graph above.
eclipse_start_flight_recording and eclipse_stop_flight_recording record the same ten iterations with JFR allocation sampling.
The same frameFilter attributes the allocation by stack, which gives the allocation rows.
For the after side, eclipse_substitute_bundle installed a org.eclipse.pde.core jar built from the PR branch and restarted the IDE with -clean.
Everything else stayed the same, so the two runs differ only in the bundle under test.
The server is open source: github.com/vogellacompany/eclipse-mcp-server.